10 Steps to Analyze AWR Report in Oracle
As you have Generated AWR Report in Oracle, Next task is to Analyze AWR Report in Oracle. By Reading AWR Report you can easily solve issues like Slow database, high wait events, Slow query and many more. Though It's a lengthy report but Analyzing or Reading relevant part of AWR Report can help to troubleshoot issues in easy and fast manner.
AWR stands for Automatically workload repository, Though there could be many types of database performance issues, but when whole database is slow, then there are two possibilities.
1. Issue with Database Machine.OS Watcher is the best tool to start.
2. If Database performance issue, Then AWR Report is the place to look at.
In case if a particular query is not performing well, i would suggest to look at execution plan of the query, stats of underlying table etc. In this case AWR won't help much.
Recommendations before getting an AWR Report.
1. Collect Multiple AWR Reports: It's always good to have two AWR Reports, one for good time (when database was performing well), second when performance is poor. This way Remote DBA can easily compare good and bad report to find out the culprit.
2. Stick to Particular Time: "Database is performing slow" will not help anymore to resolve performace issues. We have to have a specific time like Database was slow yesterday at 1 Pm and continue till 4Pm. Here, DBA will get a report for these three hours.
3. Split Large AWR Report into Smaller Reports: Instead of having one report for long time like one report for 4hrs. it's is better to have four reports each for one hour. This will help to isolate the problem.
In case of RAC env. generate one report for each instance. Once, you have generated AWR report. Now, it's time of analyze the report. Since, AWR report is a huge report and area to look into AWR is also depends on problem to problem. Here, I am list most common area for a DBA to look into which will give a clear picture of the issue.
Steps to Analyze AWR Report
1. Database Details:
After getting an AWR Report This is first and Top part of the report. In this part cross check for database and instance and and database version with the Database having performance issue.This report also show RAC=YES if it's an RAC database.

2. Host Configuration:
This will give you name, platform CUP, socket and RAM etc. Important thing to notice is number of cores into the system. In this example there are 12 CUP's in Cores.

3. Snap Shot Detail:
This are the detail about snap shot taken, Snap start time and end time. Difference between them is as "Elapsed". Here is a new term "DB Time"

DB Time= CPU Time + Non IDLE wait time.
You can find, DB time is very large as compared to Elapse time, which is not a concern. Check if you have taken a report for the time having performance problem. If yes fine, other wise take a report for performance problem time.
Next is Cache Sizes, which is just detail about SGA components.
4. Load Profile:
Here are few important stats for a DBA to look into. Fist is "DB CPU(s)" per second. Before that let's understand how DB CUP's work. Suppose you have 12 cores into the system. So, per wall clock second you have 12 seconds to work on CPU.

So, if "DB CPU(s)" per second in this report > cores in (Host Configuration (#2)).
means env is CPU bound and either need more CPU's or need to further check is this happening all the time or just for a fraction of time. As per my experience there are very few cases, when system is CPU bound.
In this case, machine has 12 cores and DB CPU(s) per second is 6.8. So, this is not a CPU bound case.
Next stat to look at are Parses and Hard parses. If the ratio of hard parse to parse is high, this means Database is performing more hard parse. So, needs to look at parameters like cursor_sharing and application level for bind variables etc.
In the above we have no issue with parses.
Parse issues usually occur as a result of:
Bad Bind variables usage
Insufficient memory
Will also be co-indicated by low percentage of memory for multiple SQL execution.
5. Instance Efficiency Percentages:In these statistics, you have to look at "% Non-Parse CPU". If this value is near 100% means most of the CPU resources are used into operations other than parsing, which is good for database health.

Note: DB Tuning must never be driven by the Hit ratios. These only provide additional information for help to understand how the instance is operating.
Meanings of particular Hit Ratios:
a. Buffer Nowait%: Shows the % of times when data buffers were accessed directly without any wait time.
b. Buffer Hit Ratio : Measures how many times a required block was found in memory rather than having to execute an expensive read operation on disk to get the block.
c. Library Hit%: Shows the % of times when SQL statements and PL/SQL packages were found in the shared pool.
d. Execute to Parse %: Shows how often parsed SQL statements are reused without re-parsing.
e. Parse CPU to Parse Elapsed %: Gives the ratio of CPU time spent to parse SQL statements.
f. Redo NoWait %: Shows whether the redo log buffer has sufficient size.
g. In-memory Sort %: Shows the percentage of times when sorts are performed in memory instead of using temporary tablespaces.
h. Soft Parse % : Shows how often sessions issued a SQL statements that is already in the shared pool and how it can use an existing version of the statement.
i. Latch Hit %: Shows how often latches were acquired without having to wait.
j. % Non-Parse CPU : Shows the percentage of how much CPU resources were spent on the actual SQL execution.
In these statistics, you have to look at
Soft Parse % ~ 100% indicates that the SQL statements are actively re-used.
"% Non-Parse CPU". ~ 100% means most of the CPU resources are used into operations other than parsing, which is good for database health.
Parse CPU to parse Elapsed % : It is very low, it reveals that oracle waits for some resources during parsing of SQL statements. To be investigated further.
Rule of thumb: Always minimize the number of Hard parses. This reduction yields the benefits of minimizing CPU overhead spent performing costly parse work.
6. Top 10 Foreground Events by Total Wait Time:
This is another most important stats to consider while looking at AWR Report for any database performance related issue. This report iscritical because it shows those database events that might constitute the bottleneck for the system. This has a list of top 10 foreground events arranged by Total Wait Time.
This is another most important stats to consider while looking at AWR Report for any database performance related issue. This report iscritical because it shows those database events that might constitute the bottleneck for the system. This has a list of top 10 foreground events arranged by Total Wait Time.

Here, first of all check for wait class if wait class is User I/O , System I/O, Others etc this could be fine but if wait class has value "Concurrency" then there could be some serious problem. Next to look at is Total Wait Time (sec) which show how many times DB was waiting in this class and then Wait Avg (ms). If Total Wait Time(sec) are high but Wait Avg(ms) is low then you can ignore this. If both are high or Wait Avg(ms) is high then this has to further investigate.
In the above screen shot, most of the resource are taken by Log file sync = 91.9% DB time and the wait class is “Commit”
In this report the event is "log file sync" which has high Waits, huge % DB time and large values in Total Wait Time (sec) and Wait Avg(ms) with wait class as commit. So, here you have to investigate further.
Note : Use highest Total Wait Time(sec) to guide investigation.
Next are Wait Classes by Total Wait Time, Host CPU, Instance CPU, IO Profile, Memory Statistics, Cache Sizes are self-explanatory.
Point to remember while checking these results :
Ø Watch for number of CPUs
Ø Pay attention to changes in Memory size
Ø An idle CPU can be a bad thing
Ø Always look at Wait IO verses CPU usage
Ø If the system is IO bound CPU will be idle!
7. Shared Pool Statistics:

In general, Memory usage % statistics should be ~70% after the DB has been running a long time. If its quite low, memory is being wasted. Here in our report we have Memory Usage % ~50% which is good.
In case if we have this to ~90% or above as shared pool consumed. This could indicate that the system experiences some overhead while aging out old shared memory structures like cursors, PL/SQL programs, and so on. This will place additional overhead on the CPU to perform reparsing aging-out. The size of the shared pool should be increased appropriately to eliminate such overhead.
The % SQL with executions >1 statistics indicate how many SQL statements are executed more than one time. This measures how well the applications are tuned and how well they make use of Bind variables.
8. Time Model Statistics:
This is a detailed explanations of system resource consumptions. Stats are order by Time (s) and % of DB Time.

Because this is cumulative time i.e. In this case SQL execute elapsed time is taking 89% of DB time, which includes it sub parts like parse time elapsed, hard parse elapsed time etc. So, if you find Hard parse time elapsed is taking more %. So investigate further so on and so forth.
DBA has to look for stat which is taking abnormal % of DB time.
9. Operating System Statistics - Detail:
This is the information related to OS, what is the load status on System shown here.

This report shows, system is 62 and 70% idle at time of report taken, So, there is no resource crunch at system level. But if, you found very high busy, user or sys % and indeed this will led to low idle %. Investigate what is causing this. OS Watcher is the tool which can help in this direction.
Next, very crucial part of AWR report for a DBA is SQL Statistics. Which has all sql query details executed during report time interval.

We will explore few of them, To understand, how to analyzed these reports. Let's start with
10. SQL Ordered by Elapsed Time:
As explained by name itself, this lists SQL queries ordered by Elapsed time into reported time interval.

In this report, look for query has low executions and high Elapsed time per Exec (s) and this query could be a candidate for troubleshooting or optimizations. In above report, you can see first query has maximum Elapsed time but no execution. So you have to investigate this.
In Important point, if executions is 0, it doesn't means query is not executing, this might be the case when query was still executing and you took AWR report. That's why query completion was not covered in Report.
11. SQL Ordered by CUP Time:
In this report, SQL queries are listed on the basis of CPU taken by the query i.e. queries causing high load on the system. The top few queries could be the candidate query for optimization.
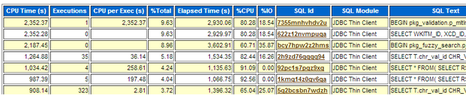
From above stat, look for queries using highest CPU Times, If a query shows executions 0, this doesn't means query is not executing. It might be same case as in SQL queries ordered by Elapsed time. The query is still executing and you have taken the snapshot.
However, There are so many other stats in AWR Report which a DBA needs to consider, I have listed only ten of them but these are the most commonly used stats for any performance related information.
Please share you view about this article, Does it helps you to understand, How to analyze AWR Report.
Refrence-http://www.dbas-oracle.com

